Context-aware heart monitor:

Sensing ECG + brain + world


Heart failure is the #1 cause of death in general, so having a strong healthy
heart is of utmost importance.
With gyms closed due to the pandemic, we find other ways to build a strong
healthy heart like running and
cold-water swimming
also known as "ice swimming".
Wearables provide a unique opportunity in healthcare, so I am proposing a
context-aware heart monitor that captures full ECG together with a
brain monitor (BlueberryX.com) and an environment monitor (temperature,
live video from surroundings, sound, etc.) so that using machine intelligence
we can learn and understand the heart in-context, i.e. in relation to the
activities being performed, both physical and mental.
The video camera with machine learning will give us a good idea of the
activities being performed as well as the environmental factors like stress
both physical and mental (e.g. crowds, confusion, dangers, traffic, etc.).
The brain monitor will give a good idea of the mental stresses that are being
faced. Together this will give us a new research direction in total
cardiac monitoring.
Dataset: swimop2021feb17 = SwimOP (Swim at Ontario Place) 2021 February 17th
I built an underwater housing for a heart monitor and turned it on and then
sealed it up around 12noon. I tested my ECG electrodes on a CRO
(Cathode Ray Oscillograph), specifically, HP1200A DUAL TRACE OSCILLOSCOPE,
to pick suitable electrodes from those that were still on my chest from an
emergency room visit Fri 2021 Feb 12th (3M rectangular electrodes).
I chose the two that were the most directly below my left nipple,
probably the ones you might call "V4" and "V5", as they
provided what looked like the best signal on the CRO.
The ECG data is in ecg_data_EXG_12.COG
and here is a simple Octave (or Matlab) m-file to read it: ecg_data_reader.m
There is also a CSV (Comma Separated Value) of that data:
exg_12.csv
Each channel is a 4-byte (32-bit) nonnegative integer value so together
there are 64 bits per sample. The best waveform appears to be
channel1 - channel2 (difference of channels) which gives the
side-to-side voltage across the heart.
The video from my Wearcam™ (wearable camera) has file creation dates
in UTC (GMT) time. The video does not run continuously (it comes on
at various times along the run), so we need to consider each time stamp.
Initial exploration:
Let's initially explore a "wearables dashboard" that overlays ECG onto the
video.
Your job is to design and implement (prototype) an
augmented reality overlay onto this data that shows heart rate, together with
ECG waveform, and other data, overlaid onto the video.
It would be nice to see the ECG waveform running across the entire width of the
screen, e.g. along the top or bottom.
You might want to have a blackground (black background) border around the video
so the waveform can be displayed as a bright green glow, as this mimics the
original cathode-ray oscillograph or SWIM view (glowing green on a blackground),
like you see here (walls painted black, room dark, etc.):

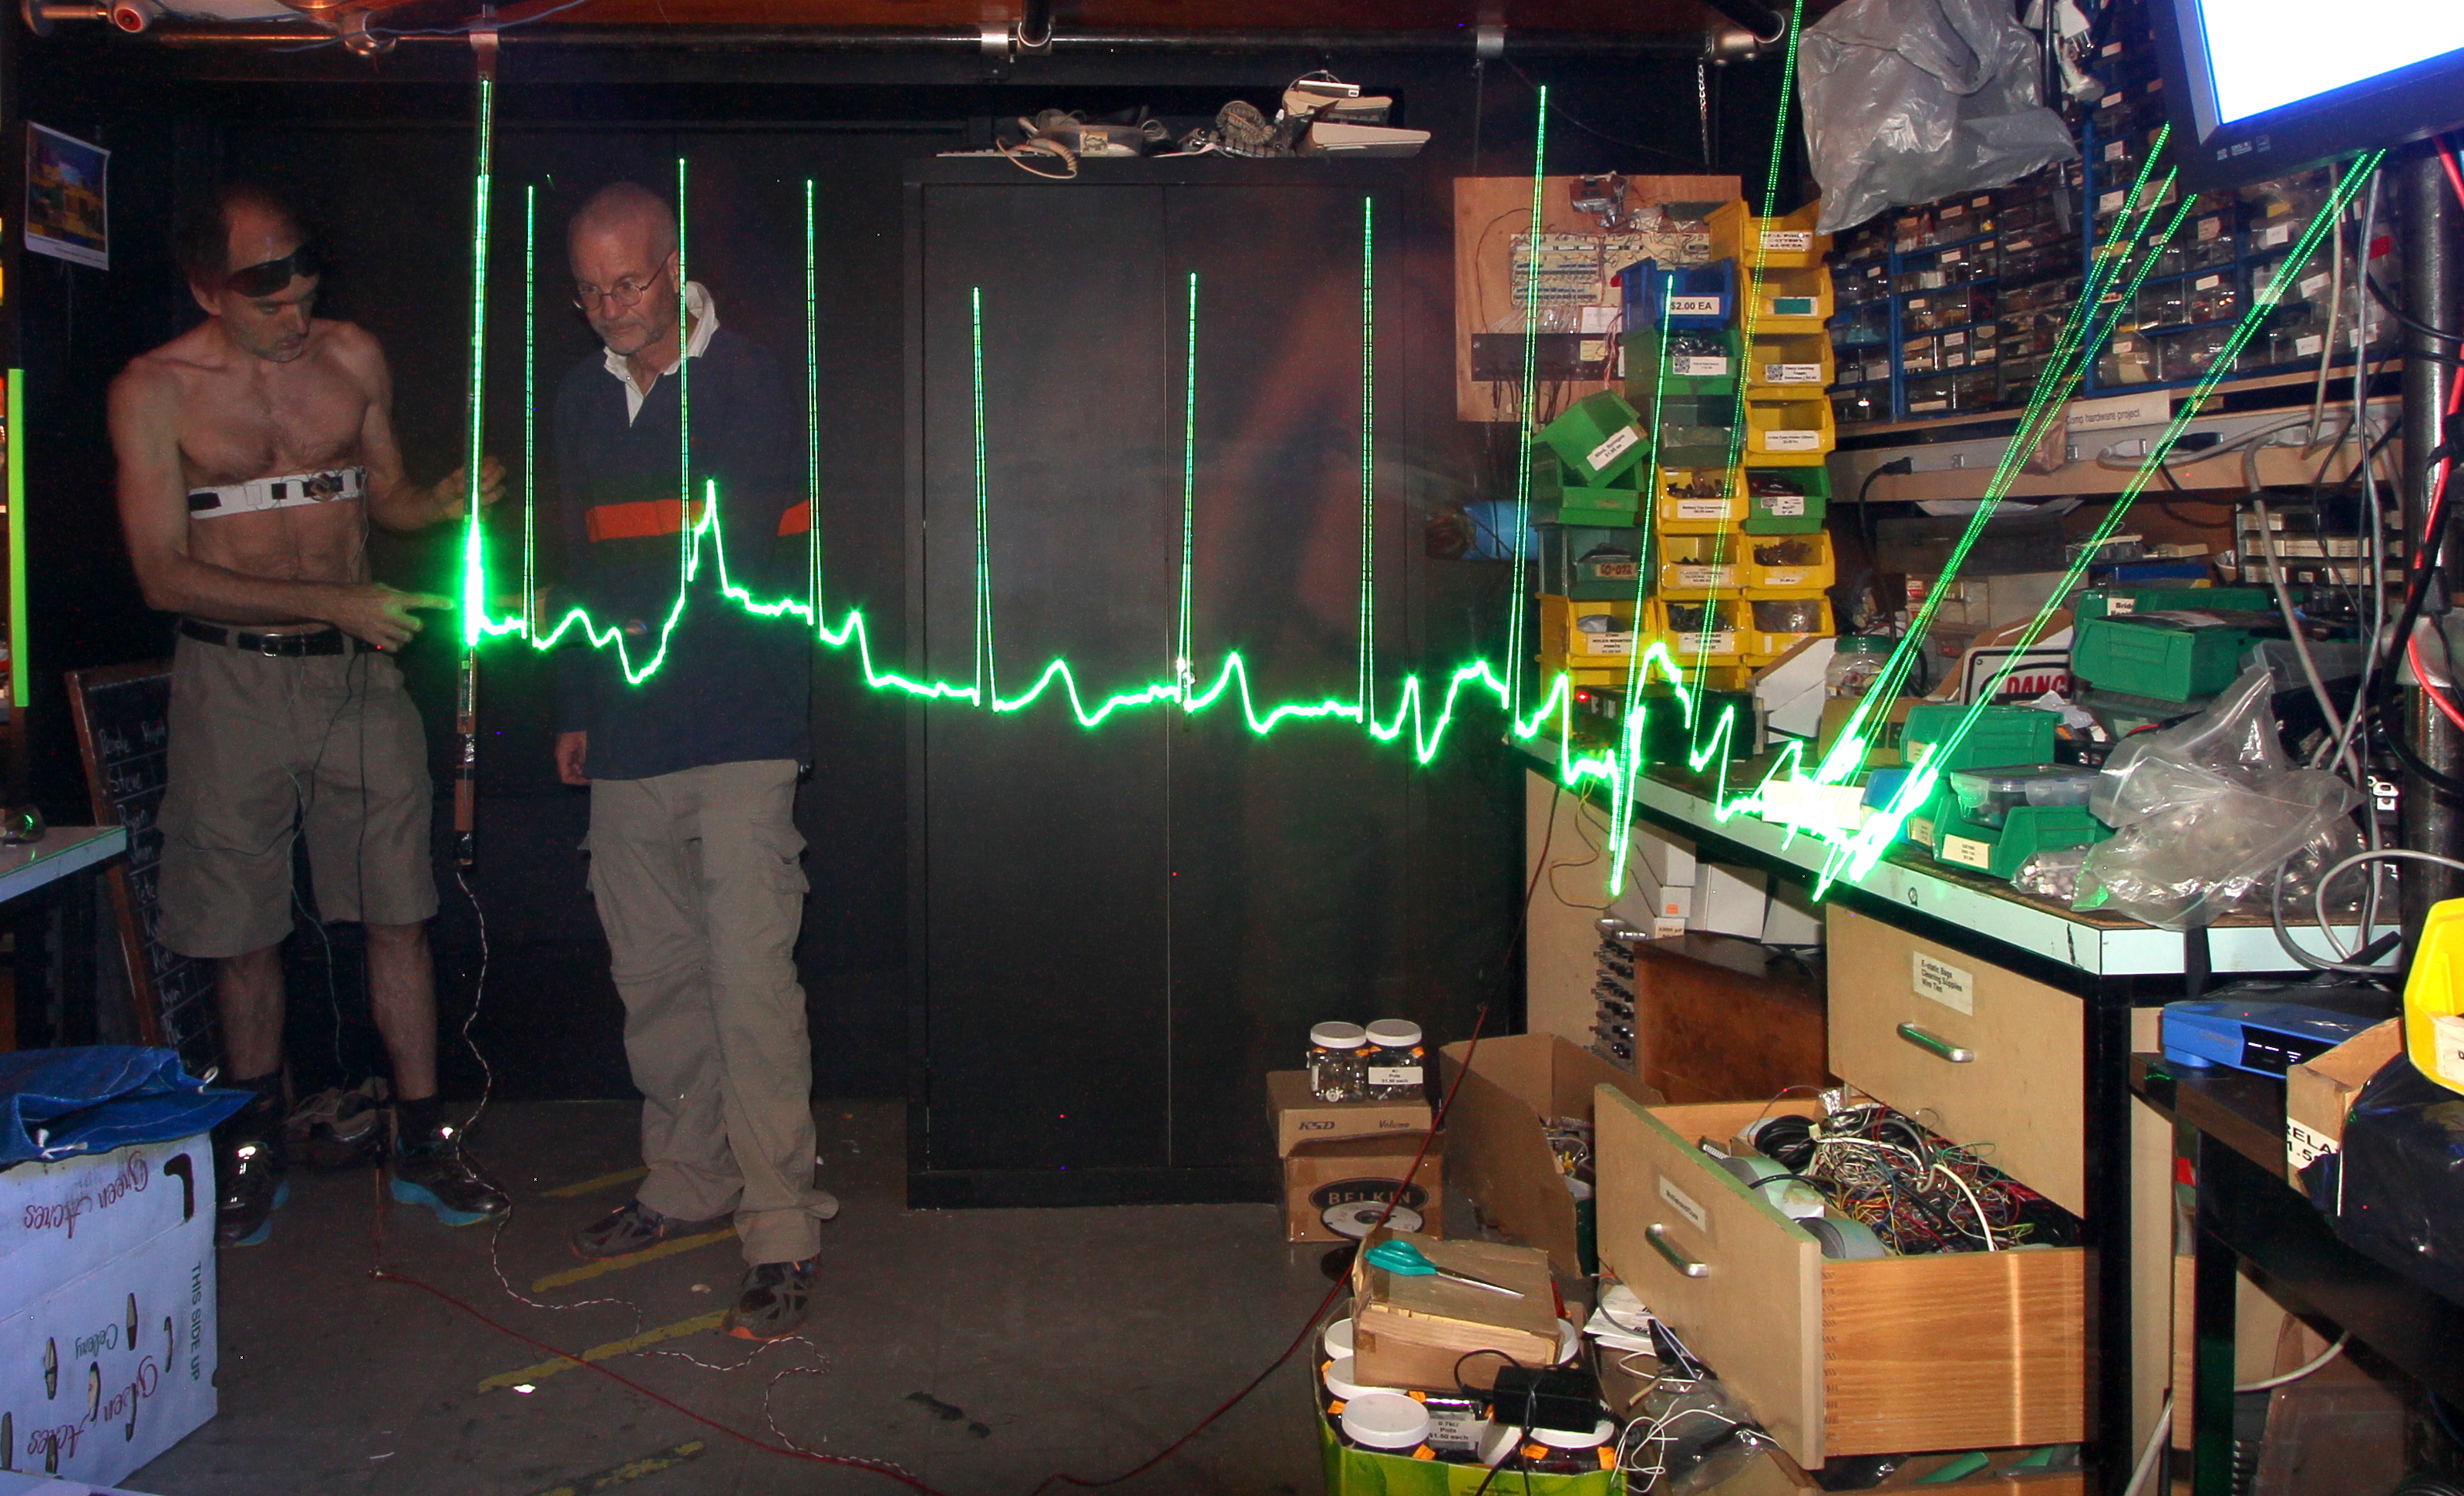
The glowing green trace on a dark background combined with live video
synchronized to it will provide both a compelling artistic effect as well as
a useful and familiar scientific diagnostic (i.e. something both the public
and medical experts will be familiar with and relate to).
You can use any of a variety of plotting programs such as GNUplot, Matlab,
Octave, or the like. Consider using a black background when you plot the
ECG so that you can use CEMENT to combine into each corresponding video frame.
Take a very short segment of video so that the problem is tractable (easy).
ECG will span a couple of seconds or a few seconds, so decide whether the center
of the ECG or the beginning or the end will align with the present frame's
timecode.
Load the ECG data
and compute a difference d=channel1-channel2 and plot portions
of this data to get an idea of when it is good and when it is not good.
Find which parts of the data are best.
1/10
Implement or find (and use) a simple peak-detector and construct an estimate
of heart-rate and
compare with the heart rate reported by the
Whoop heart monitor.
1/10
Find portions of the dataset where the data is best, and provide an
augmented reality overlay onto the video, i.e. create a dashboard with
the video in the center and surrounded by physiological quantities.
1/10
(This is a good precursor to design of a wearable biofeedback-based health
monitor.)
Use CEMENT to overlay video frames...
Video dataset is in this directory:
http://wearcam.org/ecg/swimop2021feb17/
DJI_0113.MP4 is for time synchonization, and the subsequent
videos are from the actual exercise activities (run and swim).
Going further:
Bonus marks for doing something fun and cool.
Explore AI and machine learning for realtime cardiac feedback
to the patient and to a remote cariologist along with automated notes, etc..
We're looking for students interested in being the world leaders in wearables
for physical, affective, and mental health. Show us what you can do and join
our team!